
Introduction
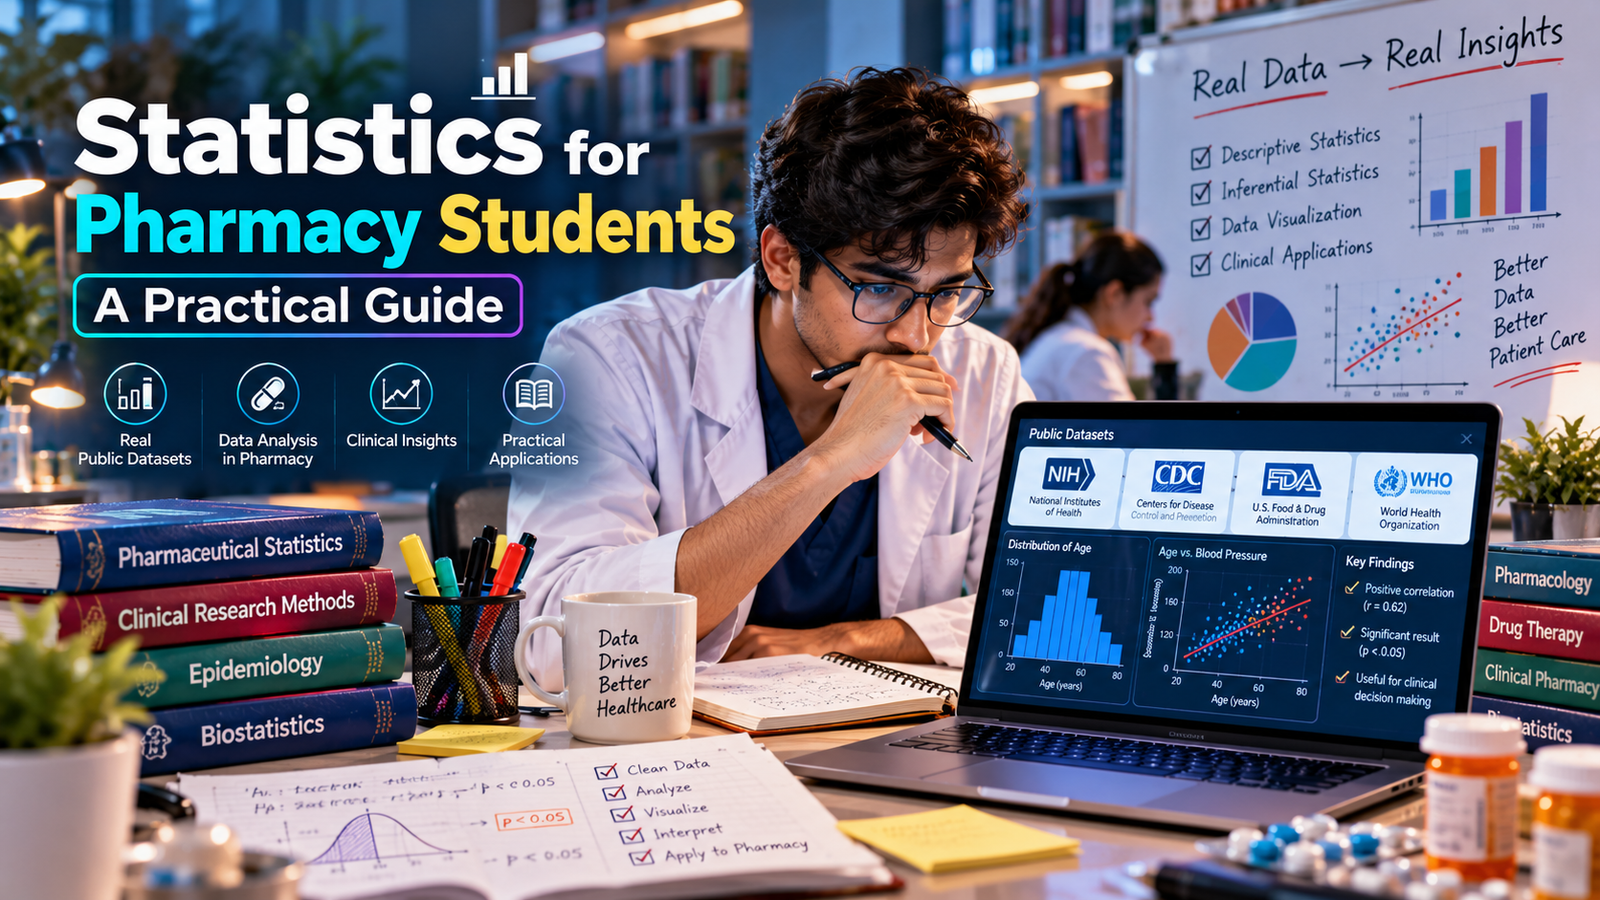
As a pharmacy student, understanding statistics is essential to analyze data and make informed decisions. With the increasing availability of public datasets, it's crucial to learn how to work with real data. In this guide, we'll explore the importance of statistics for pharmacy students and provide a practical approach to using real public datasets. For example, the National Institutes of Health (NIH) provides a wealth of public datasets that can be used to analyze various aspects of pharmacology research.
What it is / what it isn't
Statistics is a branch of mathematics that deals with the collection, analysis, interpretation, presentation, and organization of data. In the context of pharmacy education, statistics is used to analyze data from clinical trials, understand the efficacy and safety of drugs, and identify trends in patient outcomes. It's not just about memorizing formulas and procedures, but about understanding the underlying principles and applying them to real-world problems. For instance, a study published in the Journal of Clinical Pharmacology used statistical analysis to compare the effectiveness of two different drugs in treating a specific condition.
Why it matters for the target audience
Pharmacy students need to understand statistics to critically evaluate research studies, identify biases, and make informed decisions about patient care. By working with real public datasets, students can develop practical skills in data analysis and interpretation, which are essential for a career in pharmacology research. For example, a pharmacy student can use statistical analysis to identify factors that affect patient adherence to medication regimens, which can inform the development of more effective treatment plans.
Key components or steps
To get started with statistics, pharmacy students need to understand the key components, including descriptive statistics, inferential statistics, and data visualization. Descriptive statistics involve summarizing and describing the basic features of a dataset, while inferential statistics involve using sample data to make conclusions about a population. Data visualization is critical for presenting complex data in a clear and concise manner. For instance, a histogram can be used to visualize the distribution of patient ages in a clinical trial.
How it works in practice — a concrete example
Let's consider a real-world example using a public dataset from the Centers for Disease Control and Prevention (CDC). Suppose we want to analyze the relationship between age and blood pressure in a population of patients with hypertension. We can use statistical software to load the dataset, clean and preprocess the data, and then perform regression analysis to identify the relationship between age and blood pressure. For example, we might find that for every year increase in age, blood pressure increases by 1.5 mmHg.
Common challenges
Pharmacy students often face challenges when working with real public datasets, including data quality issues, missing values, and outliers. Additionally, students may struggle with selecting the appropriate statistical test or interpreting the results. For example, a student may need to decide whether to use a parametric or non-parametric test, depending on the distribution of the data.
Best practices
To overcome these challenges, pharmacy students should follow best practices, including carefully evaluating the quality of the data, using data visualization to explore the data, and consulting with experts or online resources when needed. Additionally, students should document their workflow and results, and be transparent about any assumptions or limitations. For instance, a student can use a data dictionary to document the variables and their definitions, and provide a clear description of the statistical methods used.
Common misconceptions
One common misconception is that statistics is only about memorizing formulas and procedures. However, statistics is a field that requires critical thinking, problem-solving, and communication skills. Another misconception is that statistical analysis can only be performed using specialized software, when in fact, many statistical tests can be performed using simple calculations or online tools. For example, a student can use a online calculator to perform a t-test or calculate a confidence interval.
FAQ — 5 questions readers commonly ask, with detailed answers
- Q: What is the difference between a p-value and a confidence interval? A: A p-value indicates the probability of observing a result as extreme or more extreme than the one observed, assuming that the null hypothesis is true. A confidence interval, on the other hand, provides a range of values within which the true population parameter is likely to lie.
- Q: How do I choose the right statistical test for my research question? A: The choice of statistical test depends on the research question, the type of data, and the level of measurement. For example, if the data are continuous and normally distributed, a t-test or ANOVA may be appropriate. If the data are categorical, a chi-squared test or logistic regression may be used.
- Q: What is the importance of data visualization in statistics? A: Data visualization is critical for presenting complex data in a clear and concise manner, and for exploring the data to identify patterns and trends. Visualizations such as histograms, scatter plots, and bar charts can help to communicate results to non-technical audiences.
- Q: Can I use statistical software to perform all statistical tests? A: While statistical software can perform many statistical tests, it's not a replacement for understanding the underlying principles and assumptions. Students should learn to interpret the output and understand the limitations of the software.
- Q: How can I apply statistical knowledge to real-world problems in pharmacy? A: Statistical knowledge can be applied to a wide range of problems in pharmacy, including analyzing the efficacy and safety of drugs, identifying trends in patient outcomes, and developing more effective treatment plans. By working with real public datasets, students can develop practical skills in data analysis and interpretation that can be applied to real-world problems.
Conclusion
In conclusion, statistics is a critical component of pharmacy education, and working with real public datasets is essential for developing practical skills in data analysis and interpretation. By following best practices, overcoming common challenges, and applying statistical knowledge to real-world problems, pharmacy students can become proficient in statistics and make informed decisions about patient care. As the field of pharmacology research continues to evolve, the importance of statistical analysis will only continue to grow, making it essential for pharmacy students to master these skills.